Bitcoin purchasing power
Grocery Prices in Bitcoin Since 2015
An illustrative look at how the Bitcoin amount needed for a monthly grocery basket changed alongside dollar costs and Bitcoin's market price.
Published September 2, 2026 · Updated September 2, 2026 · 5 min read
Everyday prices are usually quoted in a local currency. Looking at the same expense in Bitcoin asks a different question: how much Bitcoin would have been needed to buy it at a given time?
This research note follows an illustrative monthly grocery basket from 2015 through 2025. It is not a local price index, a household budget, or a forecast. It is a transparent comparison between an estimated dollar basket cost and the historical Bitcoin price used by the calculator.
The comparison in one line
For each year, the calculator divides the dollar value of the basket by that year’s Bitcoin price: basket cost in BTC = basket cost in USD / Bitcoin price in USD.
The result can fall when the dollar cost rises if Bitcoin’s dollar price rises faster. It can also rise when Bitcoin falls, even if grocery inflation is modest. Neither outcome says that groceries became universally more or less affordable for a particular household.
What is in the basket?
The underlying series is an illustrative global benchmark based on historical food-price trends. It represents a typical household’s monthly grocery basket, not a standardised shopping list or a local receipt.
That distinction matters. Food costs vary with household size, diet, retailer, tax, season, local wages, and region. The basket is useful for observing a consistent reference over time, but it should not be used to estimate an individual’s grocery bill.
Selected points in the series
| Year | Illustrative monthly USD basket | Bitcoin price used | Cost in Bitcoin |
|---|---|---|---|
| 2015 | $430 | $272 | 1.58 BTC |
| 2021 | $500 | $47,000 | 0.010638 BTC |
| 2025 | $610 | $85,000 | 0.007176 BTC |
The dollar basket increased from $430 in 2015 to $610 in 2025. Over the same entries, the Bitcoin amount calculated for that basket declined from about 1.58 BTC to about 0.007176 BTC.
The table is not evidence that any person experienced the same change. It describes only this illustrative basket under the supplied annual price inputs. It also smooths over the considerable price movement that occurred within each year.
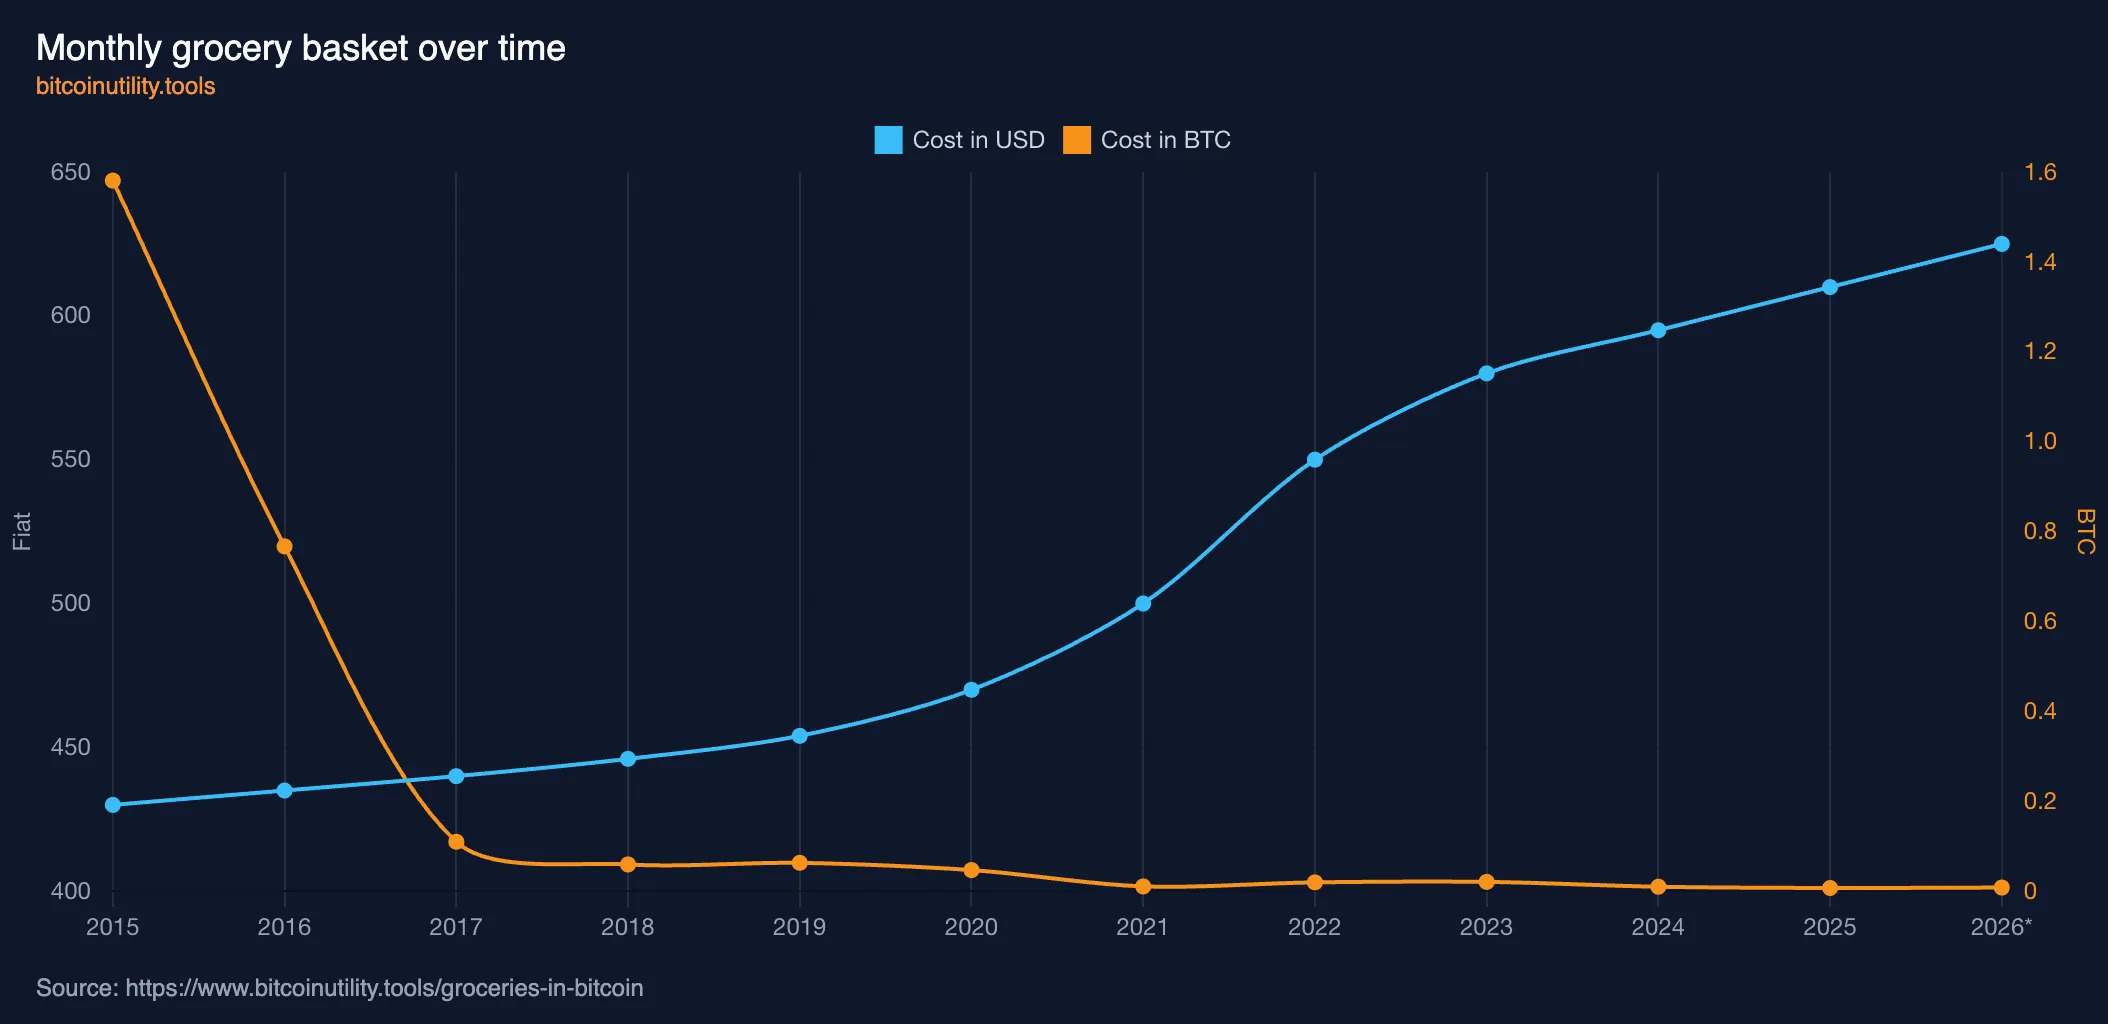 Figure 1: Monthly grocery basket cost comparison between USD and Bitcoin from 2015 to 2026.
Why currency and Bitcoin views diverge
A local-currency chart describes the nominal amount required at checkout. The Bitcoin series adds a second moving value: Bitcoin’s market price. That means the lines can diverge sharply.
Bitcoin’s price is volatile, and its changes can dominate the ratio over short periods. A lower Bitcoin-denominated basket cost does not eliminate food inflation, and a higher one does not prove that food inflation accelerated. The views answer related but different questions.
Gold and other fiat currencies add further reference points. They are conversions of the same illustrative basket using changing exchange rates and asset prices, not separate observations of grocery prices.
Explore the full series
The Grocery Purchasing Power in Bitcoin Calculator lets you compare the full series across selected fiat currencies, Bitcoin, and gold. It defaults to Bitcoin, while satoshis remain available as an optional display unit.
Use the chart to change the time period and select only the units you want to compare. Its shareable URL preserves that selection, which makes it easier to discuss one view without treating it as a forecast.
Sources and limits
The calculator’s 2015-2025 baseline uses an illustrative monthly basket and annual Bitcoin-price inputs. The 2015 local amounts remain tied to the original exchange-rate conversions, while the year-over-year progression is modeled on regional Food Consumer Price Indices rather than flat currency conversions. The UK progression is anchored to a late-2025 Food and Non-Alcoholic Beverages CPI index of 144.00, while China’s curve plateaus to reflect 0.0% annual CPI inflation in 2025. Intermediate years from 2016-2024 are mathematically interpolated to follow verifiable macroeconomic trends, including the grocery-price acceleration between 2022 and 2024. This is a visualization dataset, not a production financial dataset; the interpolated arrays should eventually be replaced by a live historical CPI API. Bitcoin spot pricing comes from CoinGecko and gold pricing from Gold-API.
Values after 2025 use a 2.5% annual grocery-cost estimate. Exchange rates and asset prices can move quickly, while the basket itself remains an estimate. The comparison excludes transaction fees, taxes, storage costs, debt, investment returns, and changes in personal income or local purchasing power.
A useful way to read the chart
Treat the chart as a record of how one consistent benchmark moved when expressed in different units. It can help frame questions about purchasing power and volatility. It cannot tell you what Bitcoin will buy in the future or which savings decision is right for you.
For a different perspective on recurring Bitcoin purchases, see the Bitcoin compound and stacking calculator. To turn a goal into labour time, use the Time to Earn Calculator.
Research
More research
Digital Economy
Digital Capital, Equity, Credit, and Intelligence: Strategy's Digital-Economy Thesis
A critical guide to Strategy's digital-economy labels, from Bitcoin and corporate equity to preferred credit and AI.
Bitcoin Gift Guide
10 Physical Gifts You Can Pay for With Bitcoin (2026 Guide)
Ten physical gifts you can buy with Bitcoin, from Peony Lane wine and El Salvador coffee to books, a mug, and useful gear.